Data Freshness Metrics and SLA Definition for AI Pipelines
AI agents amplify stale data into compounding failures that humans catch before they cascade.
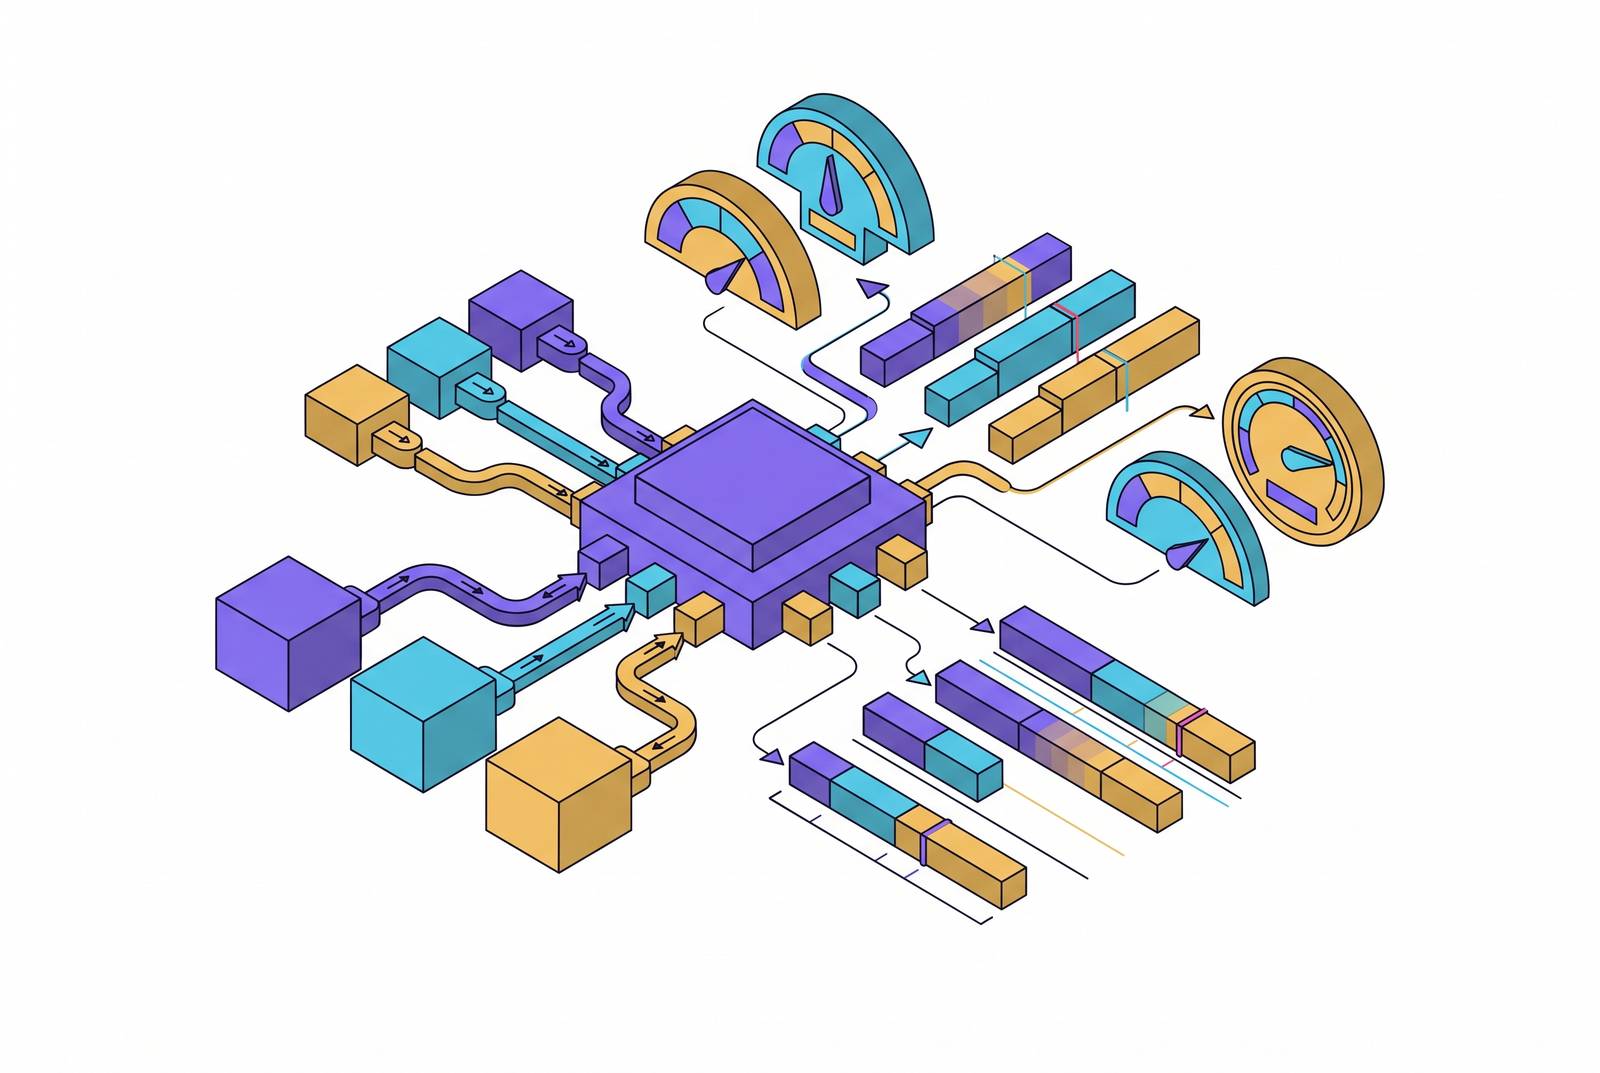
An AI agent managing order fulfillment on stale inventory data doesn't pause to question what it's seeing. An AI agent managing order fulfillment but operating on stale inventory data doesn't flag a problem, it keeps accepting orders for out-of-stock products until what would have been one unfulfilled order becomes hundreds or thousands, amplifying the problem rather than containing it. It amplifies it.
Compare that to how a stale dashboard fails. An analyst looks at a number that seems off, checks the timestamp, and escalates before anyone acts on it. In an analytics pipeline the downstream consumer is a human who can catch an anomaly; in an AI pipeline it's a model or agent with no mechanism for flagging its own uncertainty.
That absence of a self-doubt signal is what turns a freshness lag into a compounding liability. A stale row in a report is one mistake, sitting there until someone notices it. A stale row feeding an inference pipeline is one mistake per inference call, repeated at whatever throughput the agent runs at, across every workflow and every user it touches. The failure doesn't sit still waiting to be caught. It multiplies while nobody's watching.
Most organizations haven't caught up to this distinction operationally. Fewer than two in five organizations, 39.4% according to research from the IBM Institute for Business Value, report outperforming their peers on data freshness and related metrics, and most teams are applying analytics-era standards to AI-era failure modes.
The four timestamps every AI pipeline must instrument before any SLA can mean anything
Freshness can't be managed as a single number. It has to be broken into four distinct timestamps, and skipping any of them collapses root cause analysis into guesswork. The four are event time, when something actually happened; ingestion time, when it entered the system; processing time, when it got transformed; and availability time, when it finally became queryable.
Each one isolates a different kind of failure, and each failure has a different fix. A pipeline might ingest data quickly but bottleneck at the processing stage. Another might process fast end to end but still sit on data for an hour before making it available to a query engine. Without all four timestamps captured on every event, those two failures look identical from the outside, and a team debugging "why is the agent's context stale" ends up chasing the wrong layer entirely.
Without four distinct timestamps on every event, freshness metrics collapse into a single number that conflates different failure modes and makes root cause analysis impossible. Event-time lag, the gap between when something happened and when it became available, captures the total delay a consumer actually experiences. End-to-end latency, measured from ingestion to availability, isolates how well the internal pipeline itself is performing, stripped of whatever lag existed before the data even arrived.
Bruin's framework gives a clean operational definition of freshness: how old the newest row in a table is relative to when it was supposed to arrive. A table that loads hourly but whose newest row is five hours old is stale, no matter how fast the pipeline's nominal processing time looks on paper. Completeness rides alongside freshness as its necessary companion: whether the rows that should have shown up in the latest load actually did. Together, these two catch the most expensive class of incident in any pipeline, the one where nothing crashes and nothing errors out, it just quietly stops running.
Architecture changes how freshness gets measured, and conflating architectures under one SLA threshold is a common design mistake. Batch pipelines measure freshness as the gap between a scheduled run and its actual completion. Conduktor's framework treats a daily ETL that should finish by 6 AM but doesn't as a freshness violation even if the data itself is correct. Streaming pipelines measure it continuously as event-time lag, with Bruin recommending a default threshold of twice the expected interval, so an hourly pipeline gets a two-hour ceiling before it's flagged.
AI pipelines frequently run both models at once. A retrieval-augmented generation system might pull from a vector index that refreshes on a batch schedule while simultaneously hitting a real-time web retrieval layer, all inside a single inference call. Without separate SLAs on each of those layers, a team has no way to tell which one introduced the staleness when the agent's answer turns out to be wrong.
Six observability pillars for AI pipelines, and the sixth one most teams skip
Five pillars have defined structural pipeline observability for years: freshness, volume, distribution, schema, and lineage. Barr Moses established that framework at Monte Carlo, and Monte Carlo, Acceldata, and Anomalo all build strong tooling around it. Monte Carlo pushed the framework further in March 2026 with a new Agent Observability product built around four named pillars of its own, context, performance, behavior, and outputs. All five of the original pillars remain necessary for AI pipelines. None of them, alone or together, is sufficient.
Atlan's analysis defines freshness for an AI consumer as data arriving inside the window an agent expects it in, and treats a metric definition that hasn't been updated in 18 months as a freshness violation even if every timestamp checks out. Distribution monitoring watches whether statistical properties stay within expected ranges, and feature drift between training time and inference time is the AI-specific failure mode here. Lineage has to stretch further too: for an AI pipeline, lineage needs to trace from source through retrieval through inference all the way to output, not stop at the point where data enters the model.
None of that reaches the sixth pillar, semantic integrity, and this is the one that catches what the other five structurally cannot. A column named customer_status can sail through every freshness check, every volume check, every distribution and schema check, while its actual business meaning quietly shifts from "account active" to "contract pending renewal." Not one structural monitor will notice, because nothing about the column's shape, arrival time, or row count changed.
Picture a revenue reporting agent querying a pipeline where every single structural check reads green. The agent still returns the wrong number, because the definition of "net revenue" changed three weeks earlier and the cached context layer that feeds the agent was never updated to reflect it. Every dashboard says the pipeline is healthy. The agent's output is wrong anyway, and nothing in the standard observability stack would have flagged it.
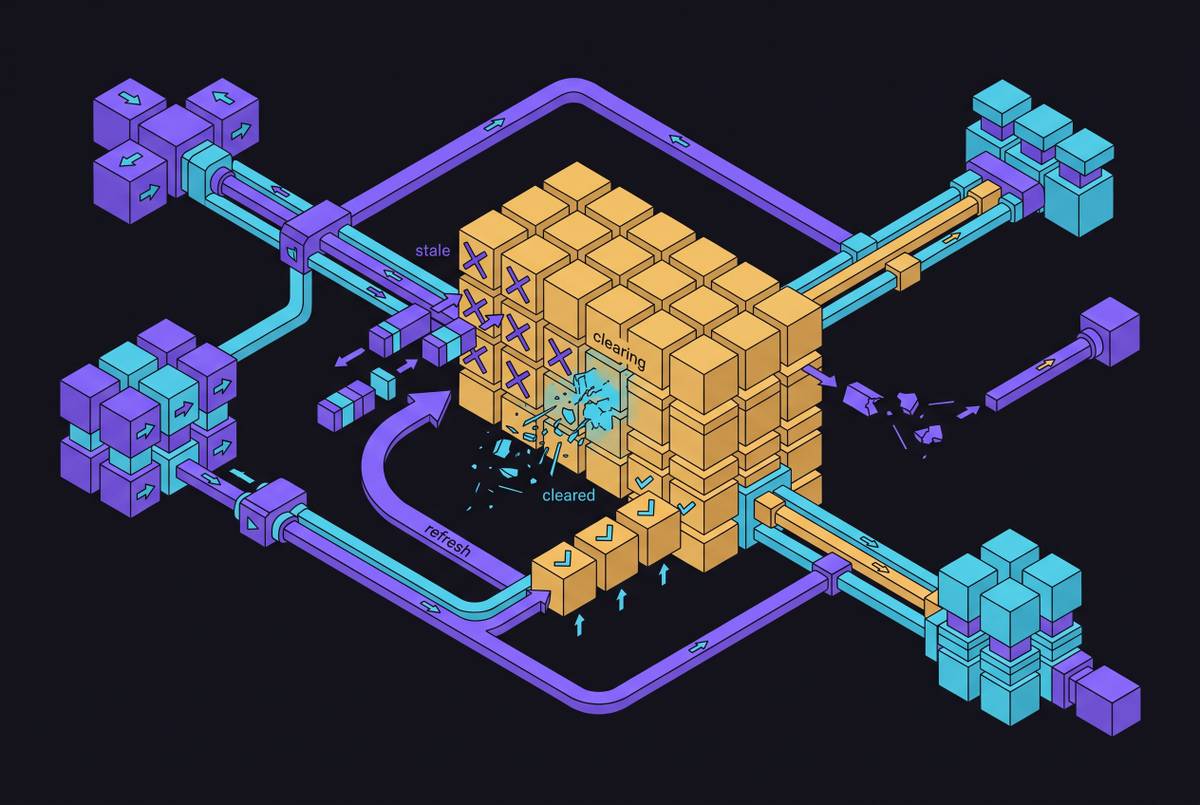
RAG pipelines add their own version of this problem through vector indexes. A vector index can be structurally flawless, correct schema, normal volume, no distribution anomaly, while the embeddings inside it describe documentation or code that no longer exists in the live system. The clearest version of this is an agent retrieving a deprecated API from an old README and calling it with full confidence, simply because nobody refreshed the index when the underlying repository changed. Catching that requires tracking embedding refresh timestamps against source change timestamps directly, rather than trusting that an index being "available" means it's current.
The three-mechanism monitoring setup that closes the gap structural checks leave open
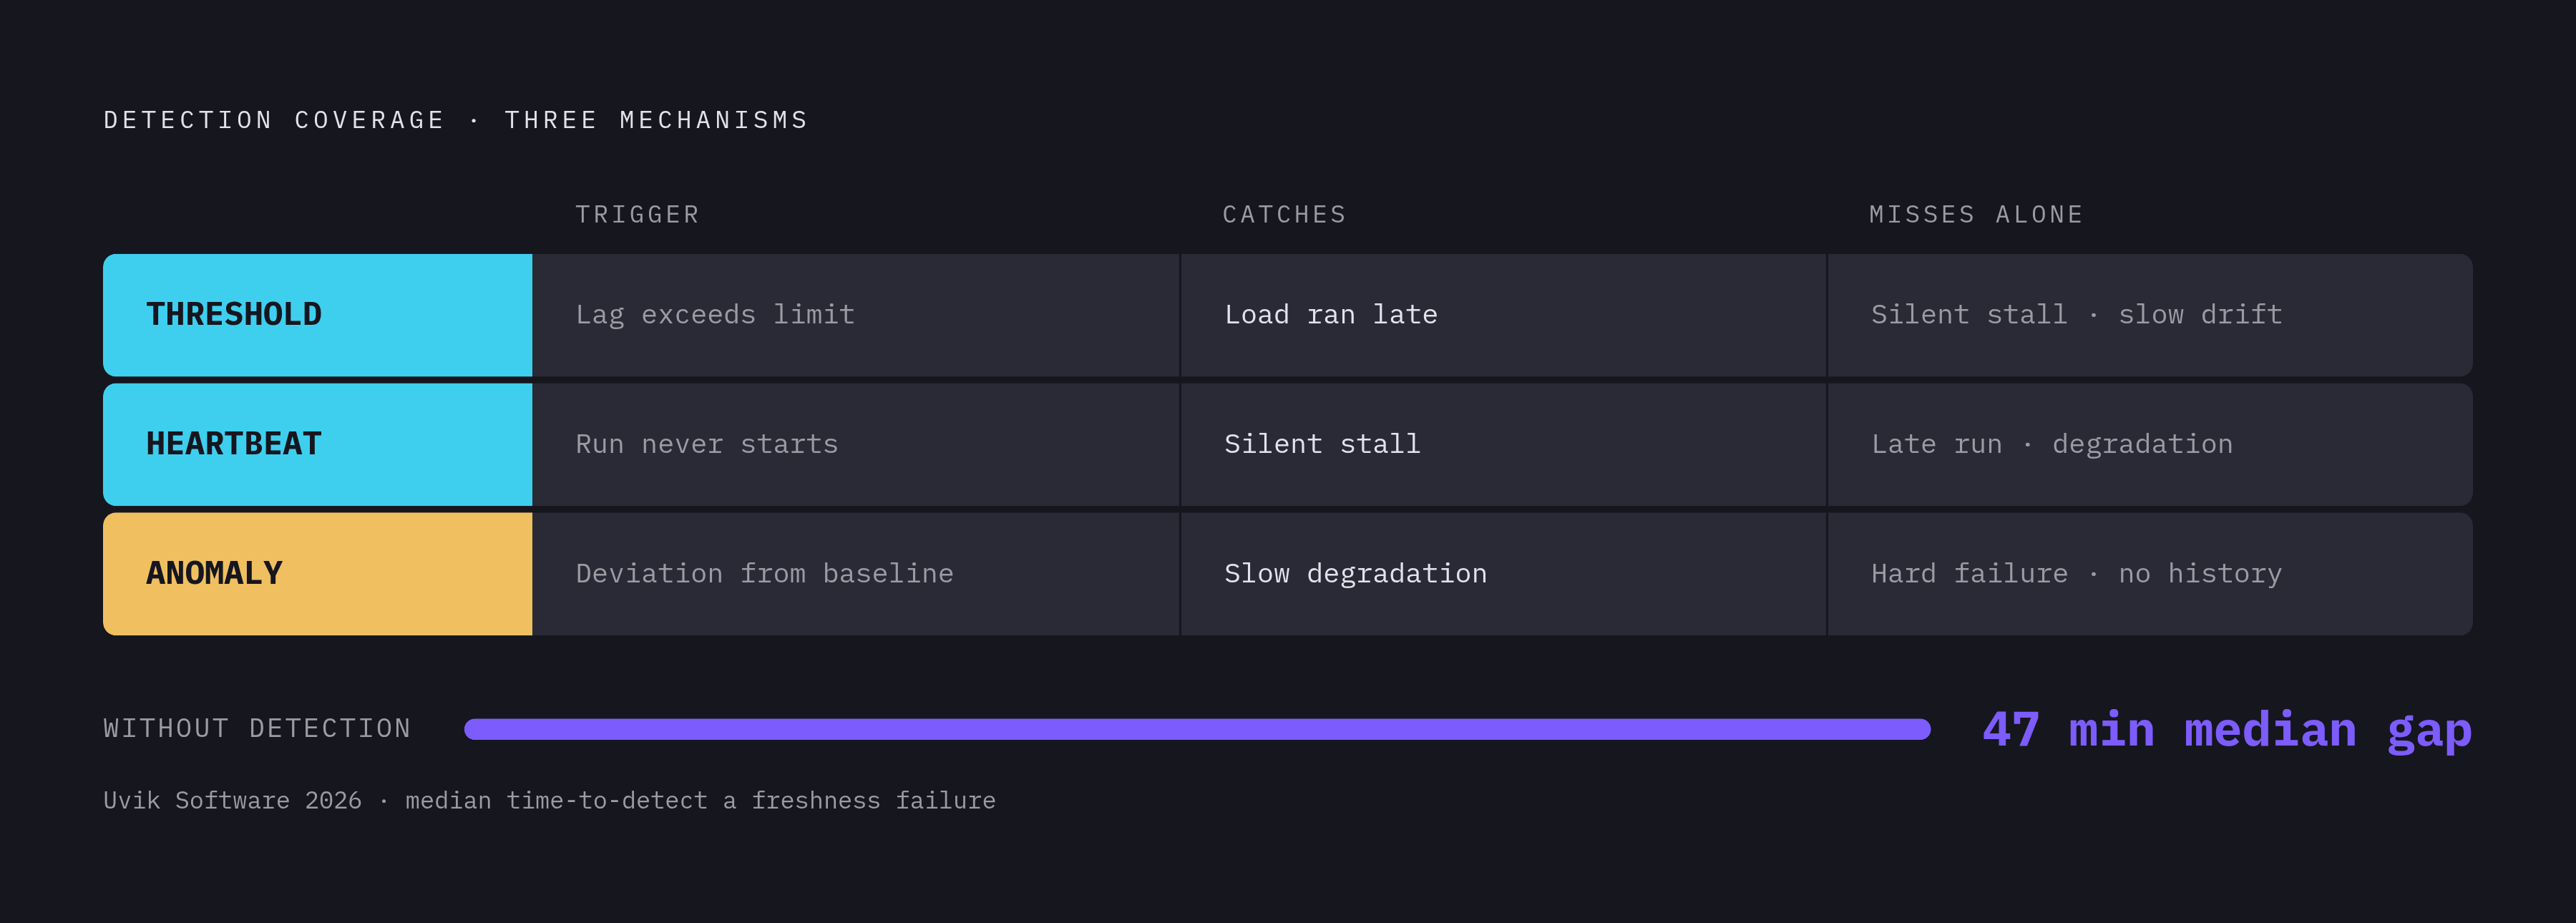
Relying on a freshness threshold alone is a known trap: a pipeline that dies completely emits no data, so it never crosses a lag threshold, and the alert built to catch lateness never fires.
The first is the threshold itself: a rule on the freshness indicator that fires once data exceeds a defined lag limit. Bruin's approach declares this check directly on the pipeline asset rather than bolting it onto a separate monitoring job, so a violation blocks downstream assets from running on bad data. The second is the heartbeat, a schedule-level alert triggered when a run fails to start on time. This is what catches the silent stall, no rows and no error, that a threshold check can never see because if the pipeline never runs, the check tied to it never runs either.
The third mechanism is anomaly detection, which flags a deviation from a learned baseline before the pipeline ever crosses its hard threshold. Without automated detection in place, Uvik Software's 2026 benchmarks put the median time to detect a freshness failure at 47 minutes. ML-based anomaly detection adjusts automatically to seasonal patterns and growth trends, which removes the constant manual retuning of thresholds that otherwise generates a steady stream of false positives.
The threshold catches a load that ran late. The heartbeat catches a load that never ran. Anomaly detection catches a load that's degrading, trending toward a violation it hasn't technically crossed yet.
The tooling to build all three exists and is mature. Threshold checks run through dbt source freshness, Bruin's custom checks, Soda, or Great Expectations, all of which express freshness rules at the asset level. Heartbeat monitoring runs through Airflow SLAs, Bruin Cloud's schedule alerts, or native run-start monitoring built into most orchestrators. Anomaly detection runs through Monte Carlo, Acceldata, Anomalo, or a Prometheus and Grafana setup that computes lag and stores its history automatically. Gartner projects that half of enterprises will have adopted data observability tools by 2026, up from under a fifth in 2024. Adoption is accelerating fast, but tooling deployed without defined rules and thresholds behind it just produces dashboards full of numbers that don't support any actual operational decision. The bottleneck was the definitions teams feed into the tooling, not the tooling itself.
Defining SLAs for AI pipeline consumption patterns
An SLA must name its dataset type, its consumer, and its semantic validity window. It's a monitoring alert wearing an SLA's name, and it will get violated in ways the alert was never built to catch. Practitioner consensus has settled on a clear pattern here: every dataset needs an explicit contract tied to how it actually gets consumed, and those tiers map cleanly to dataset type: real-time metrics need under 2 minutes of delay, near-real-time needs tighter turnaround than batch allows, and daily batch jobs need to be available by a fixed cutoff like 6 AM.
Skip the dataset-specific tiering and monitoring stops meaning anything. An hourly ad-serving pipeline and a nightly finance pipeline cannot share a single threshold, because a 30-minute lag is a critical failure for one and a complete non-event for the other. Promethium's 2026 KPI guide recommends hourly cadences for ads, daily for CRM data, and nightly for finance, precisely because a single shared number would misclassify violations on both sides.
AI pipelines need something beyond timestamp lag entirely: a fourth dimension called the semantic validity window, which measures how long a piece of retrieved context stays valid for the decision an agent is making, regardless of when that context technically arrived. This is the concept that separates an AI pipeline SLA from an analytics pipeline SLA. A market price retrieved thirty seconds ago can already be too stale for a trading agent executing on it in real time, while a legal definition retrieved six months ago might still be perfectly valid for a compliance agent checking a filing against it. The pipeline schedule tells you nothing about which of those two is true. What defines the validity window is the consumer's own calibration, meaning what the agent was actually trained or prompted to expect from that piece of context.
Context engineering is what turns this from a monitoring concept into an enforcement mechanism. Retrieval gets filtered by tenant, by permission, by freshness, and by the specific need of the workflow requesting it, which makes freshness a routing constraint baked into the system rather than an alert somebody reads after the fact. When that context engineering layer routes around results that fail a freshness check, the SLA gets enforced at the moment of inference, not just at the moment data was ingested.
A complete AI pipeline SLA rests on five components, and all five need to be present for the contract to be measurable and enforceable. It needs a timestamp column that defines freshness, such as updated_at, _loaded_at, or an equivalent the loader adds itself when the source doesn't supply one. It needs an expected interval drawn from the pipeline's own schedule, since that's the baseline every lag calculation gets measured against. It needs a lag threshold specifying how late is too late, with twice the expected interval as a sound structural default and tighter thresholds warranted for pipelines serving live inference. It needs a completeness condition defining what "complete" means for the latest period, such as a minimum row count or an allowed deviation from a trailing average. And it needs the semantic validity window itself, set per dataset and per agent use case, specifying how long that content stays usable for the specific decision it's feeding.
The operational KPIs for meeting your SLAs
The right KPI set for tracking AI pipeline freshness is deliberately narrow: eight metrics. The most important of the eight is a composite metric, and its value comes specifically from the fact that no team can improve it by optimizing just one input in isolation.
That metric is data downtime, calculated as the number of incidents multiplied by the sum of time-to-detection and time-to-resolution. Promethium's 2026 KPI guide treats this as the master figure precisely because it maps directly to business impact and can't be gamed by shaving time off only one half of the equation. A team could cut its detection time to near zero and still post terrible downtime numbers if resolution drags on, and the reverse holds just as true.
Time-to-detect deserves its own scrutiny as a standalone figure: the gap between the moment a freshness violation actually occurs and the moment a team learns about it. Organizations that keep this figure under 30 minutes see substantially fewer cascading failures than those that don't, and in the worst cases, where no real monitoring exists at all, detection can stretch out to months rather than minutes. Uvik client data shows teams without automated monitoring in place run a median time-to-detect that sits well above teams that have it. A threshold, a heartbeat, and anomaly detection working together justify the investment because each catches what the others miss.
Sources
- SLAs: Ensuring Reliability in Data Pipelines
- Data Observability for AI Pipelines: The Sixth Pillar [2026]
- What Is Data Freshness? How to Measure and Monitor It in a Pipeline | Bruin Blog
- Data Observability Metrics That Matter in 2026: Core KPIs
- Data Quality Metrics & KPIs for Data Engineering Teams
- Data Freshness Monitoring: SLA Management | Conduktor
- What Is Data Freshness? | IBM